Patok Lab ES

Variation, causes and the next run Available

From a table of runs to the next experiment.

Twenty suspects and one result that moves. Patok Lab narrows them with the runs you already have, says how much of the variation each one explains, and picks the single run that will confirm it — then records what actually happened, so the next question starts from evidence instead of memory.

From one measurement to a distribution, from a distribution to a surrogate surface, from the surface to the next experiment.

Six steps, one project

  1. 01

    Bring your table

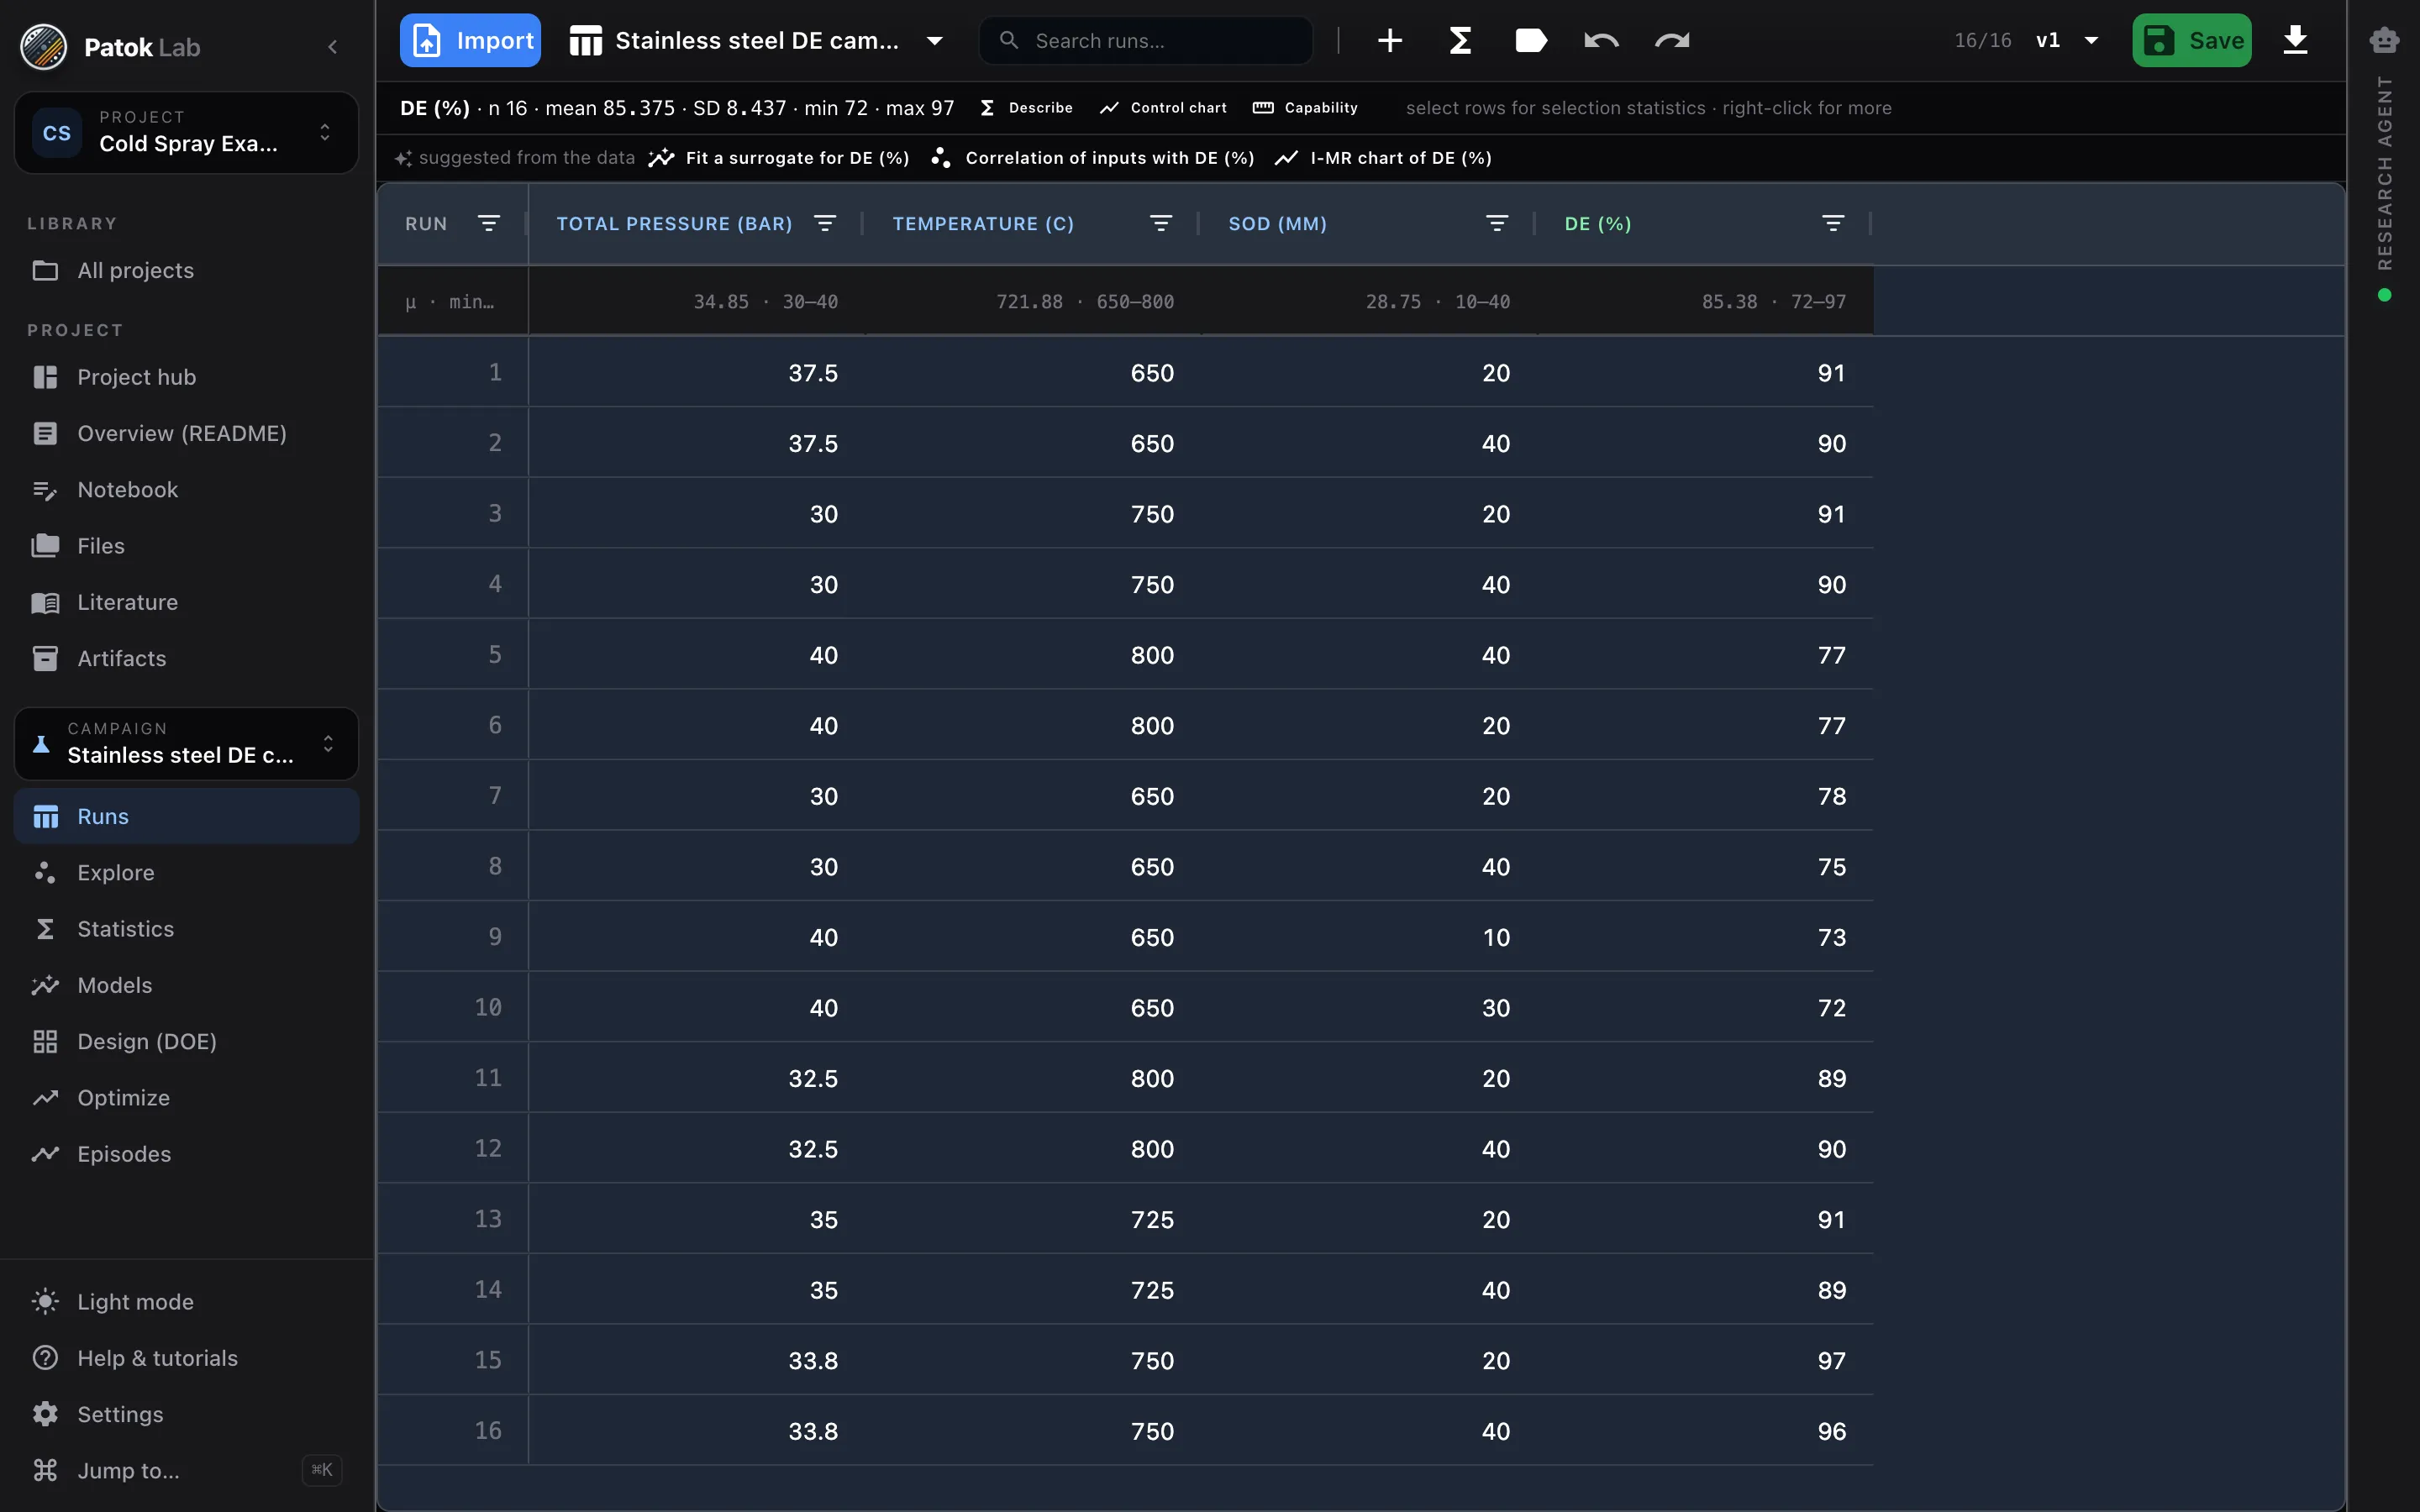
    Excel or CSV. Classify columns as inputs, responses, categorical factors and metadata; set units and physical bounds. Versioned saves; the source file is never modified.

    Runs table with roles
  2. 02

    Understand what happened

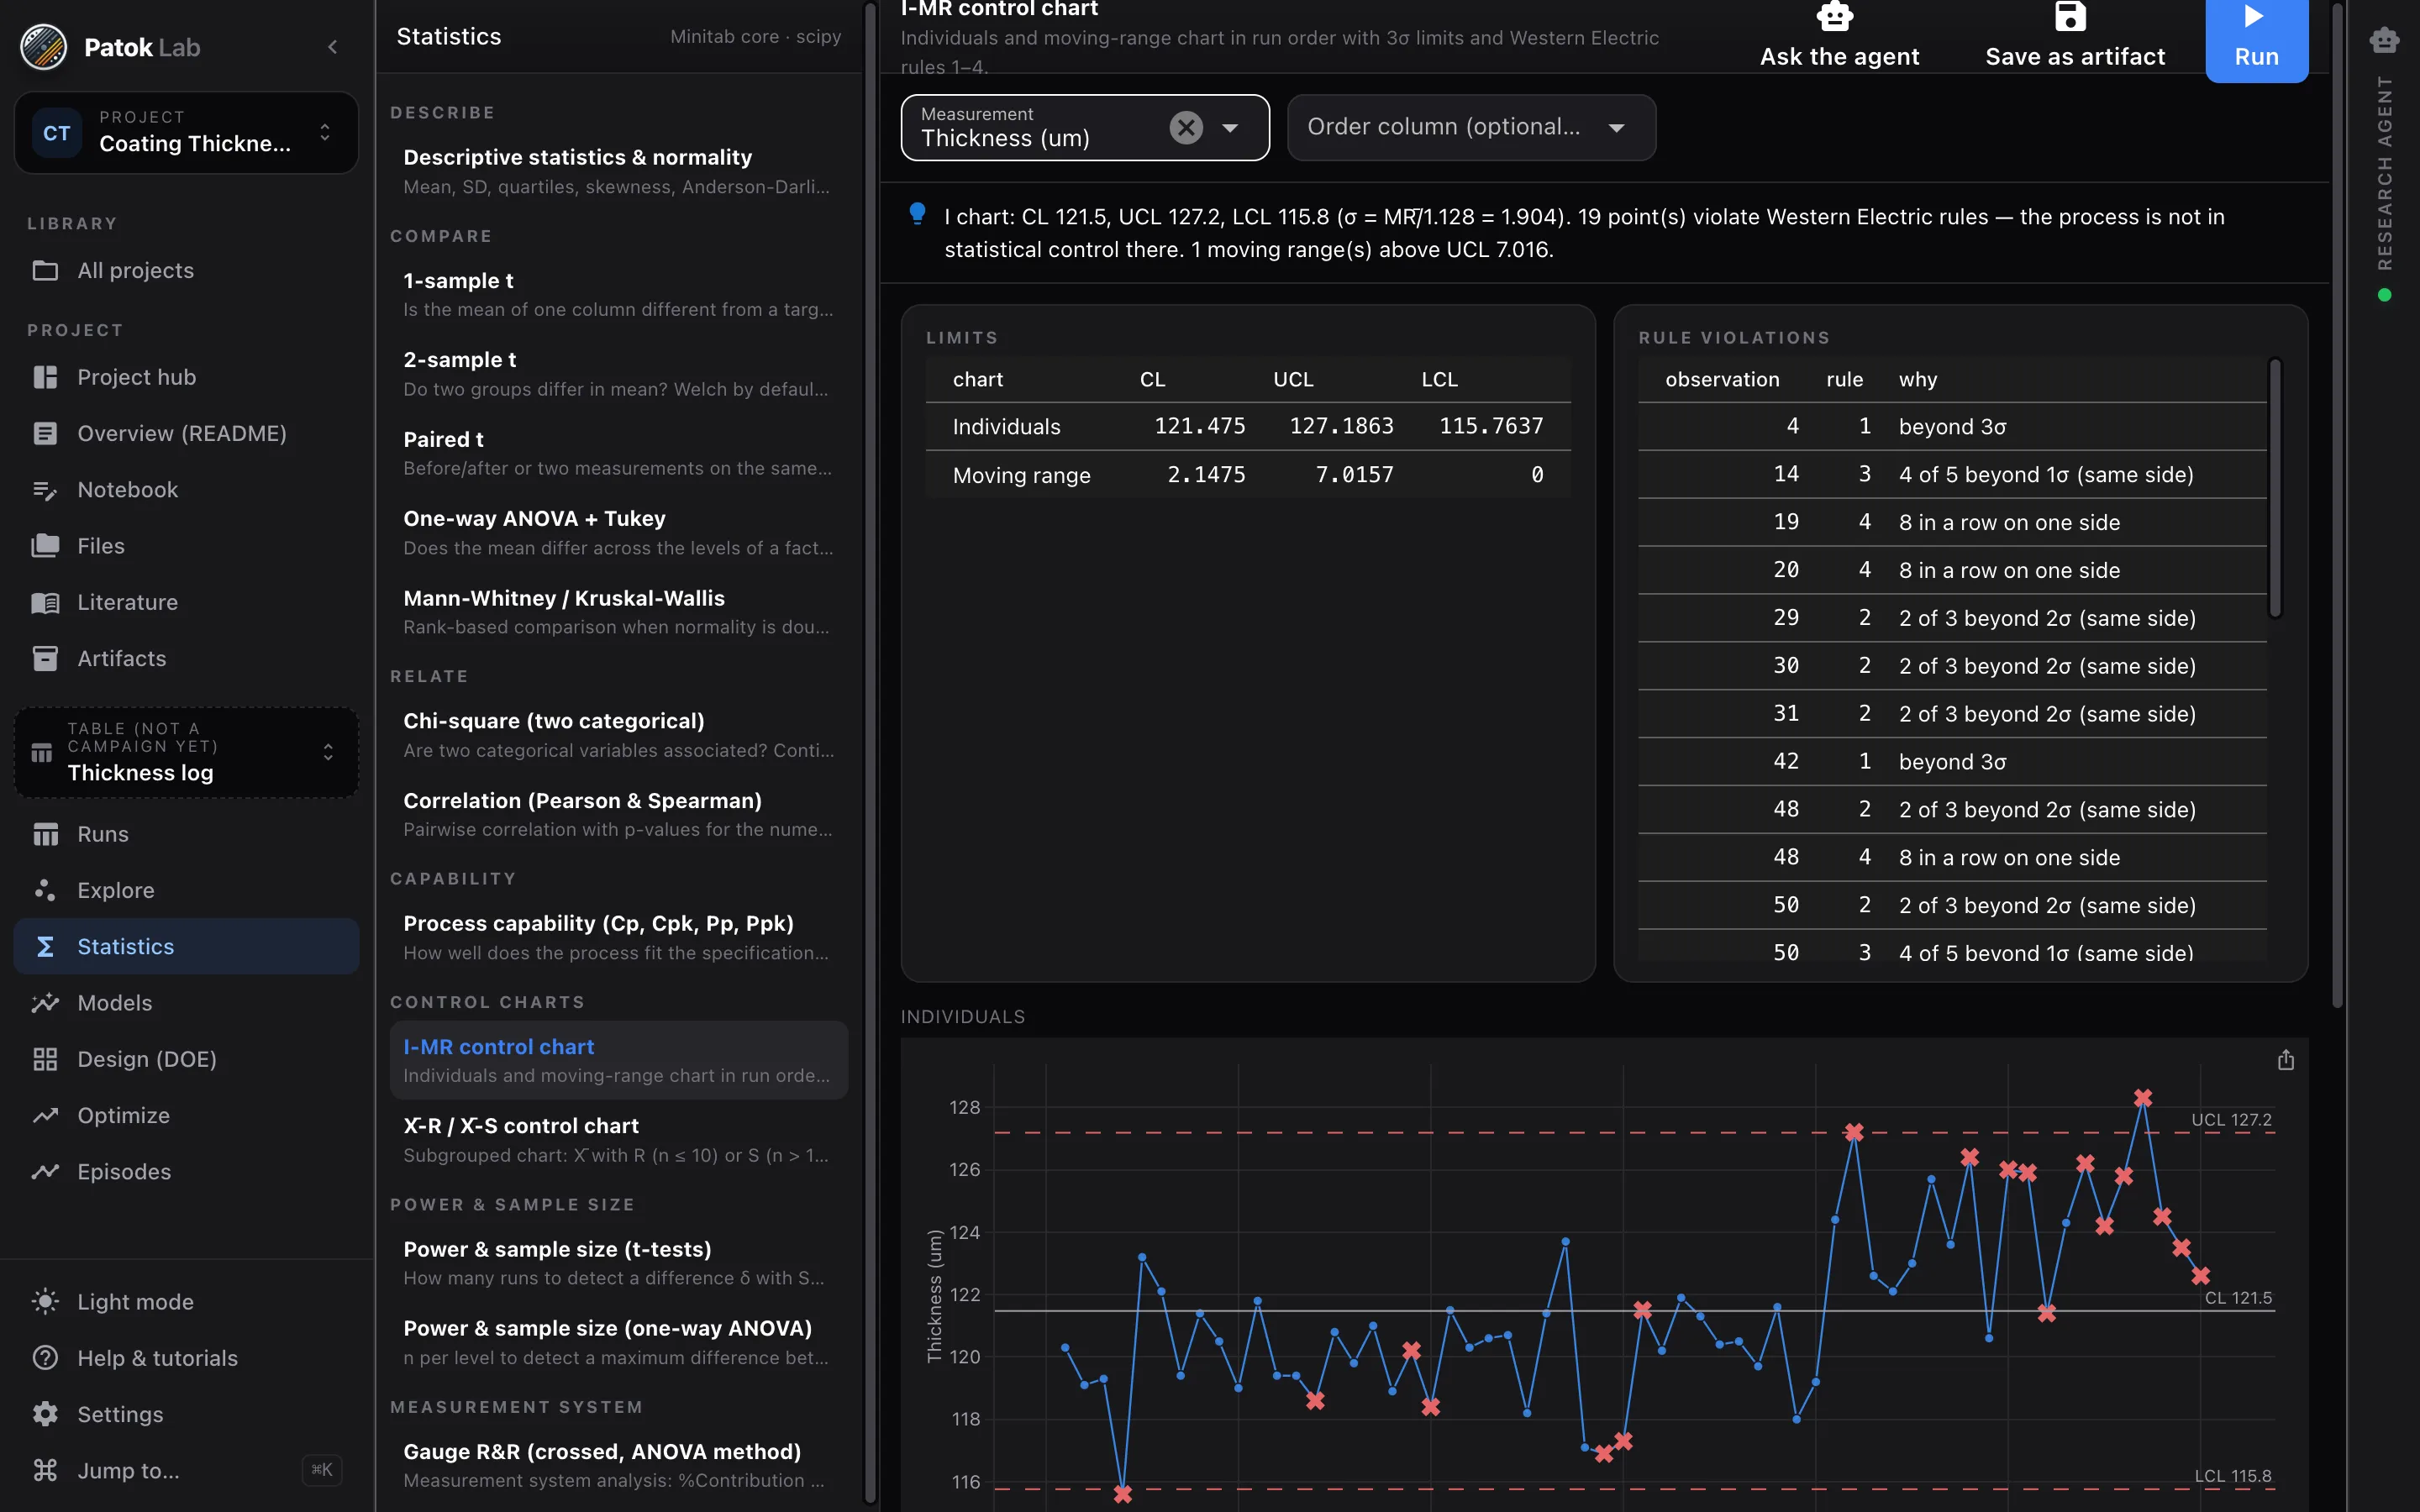
    Fourteen statistical procedures with plain-language readings, curve fitting with AIC ranking, response surfaces of the active model.

    Statistics view: I-MR control chart
  3. 03

    Model and verify

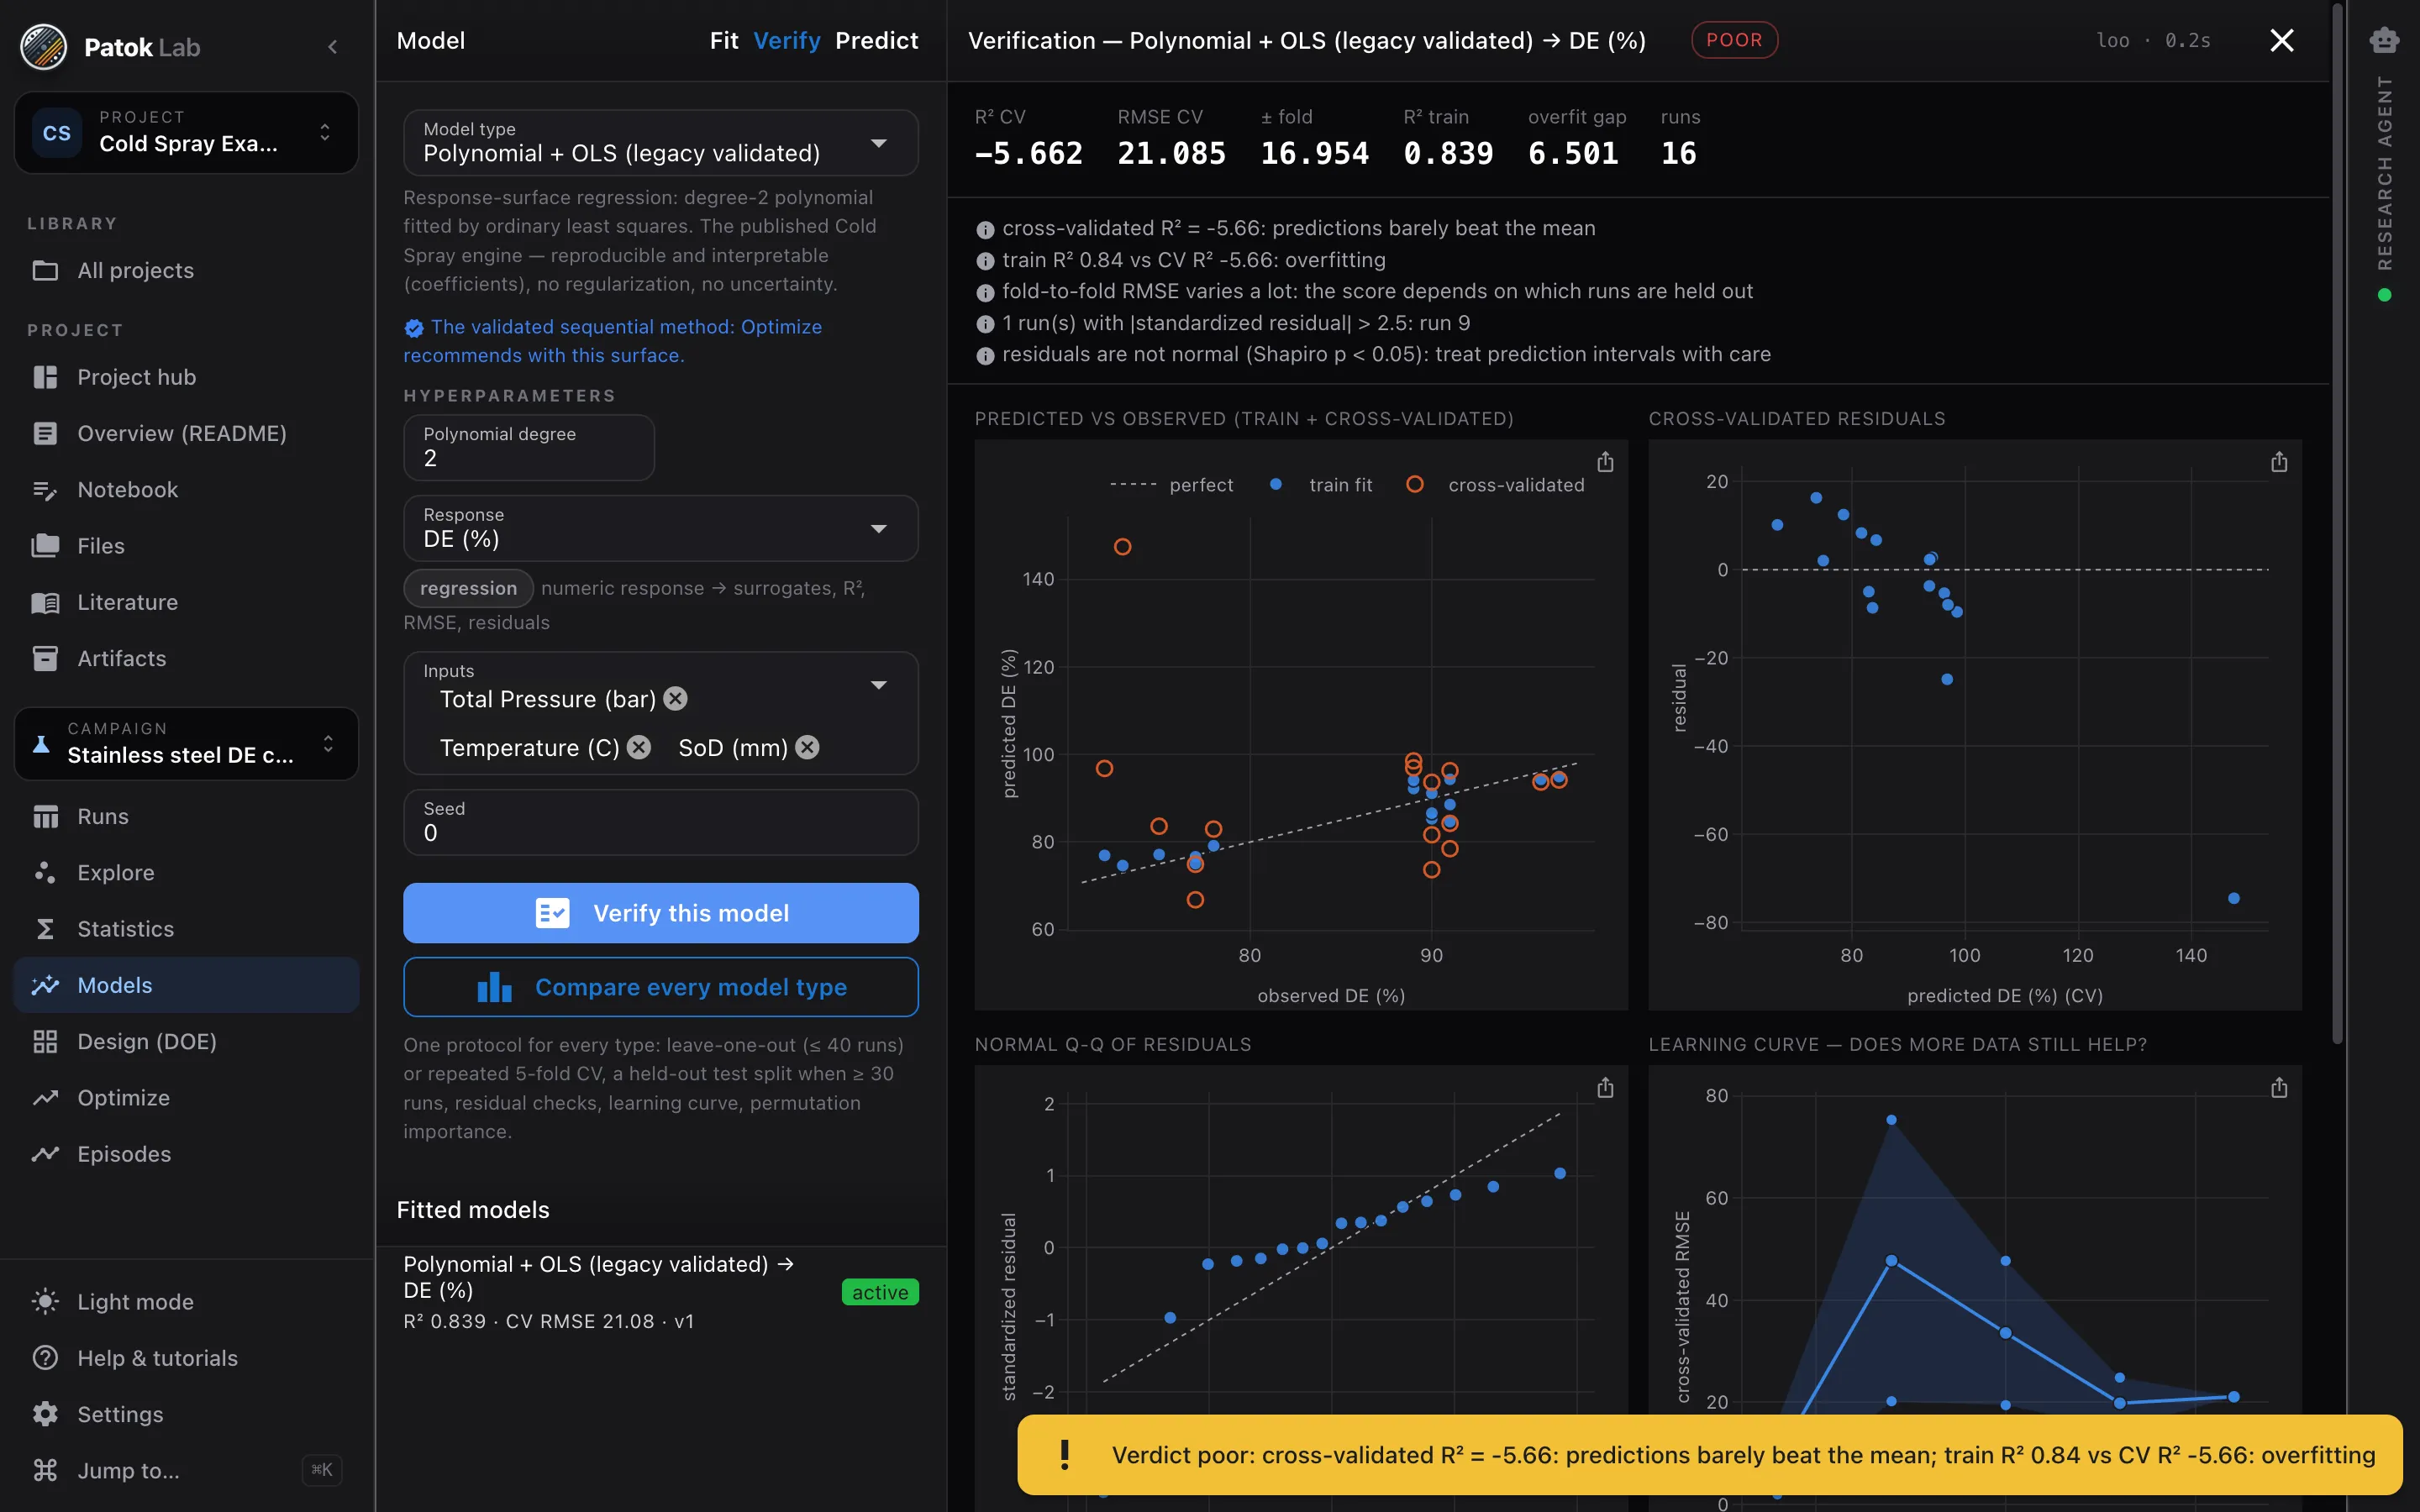
    18 regression and 9 classification types under one verification protocol: cross-validation, held-out tests, residuals, learning curves, an honest verdict.

    Models verification report
  4. 04

    Design or decide

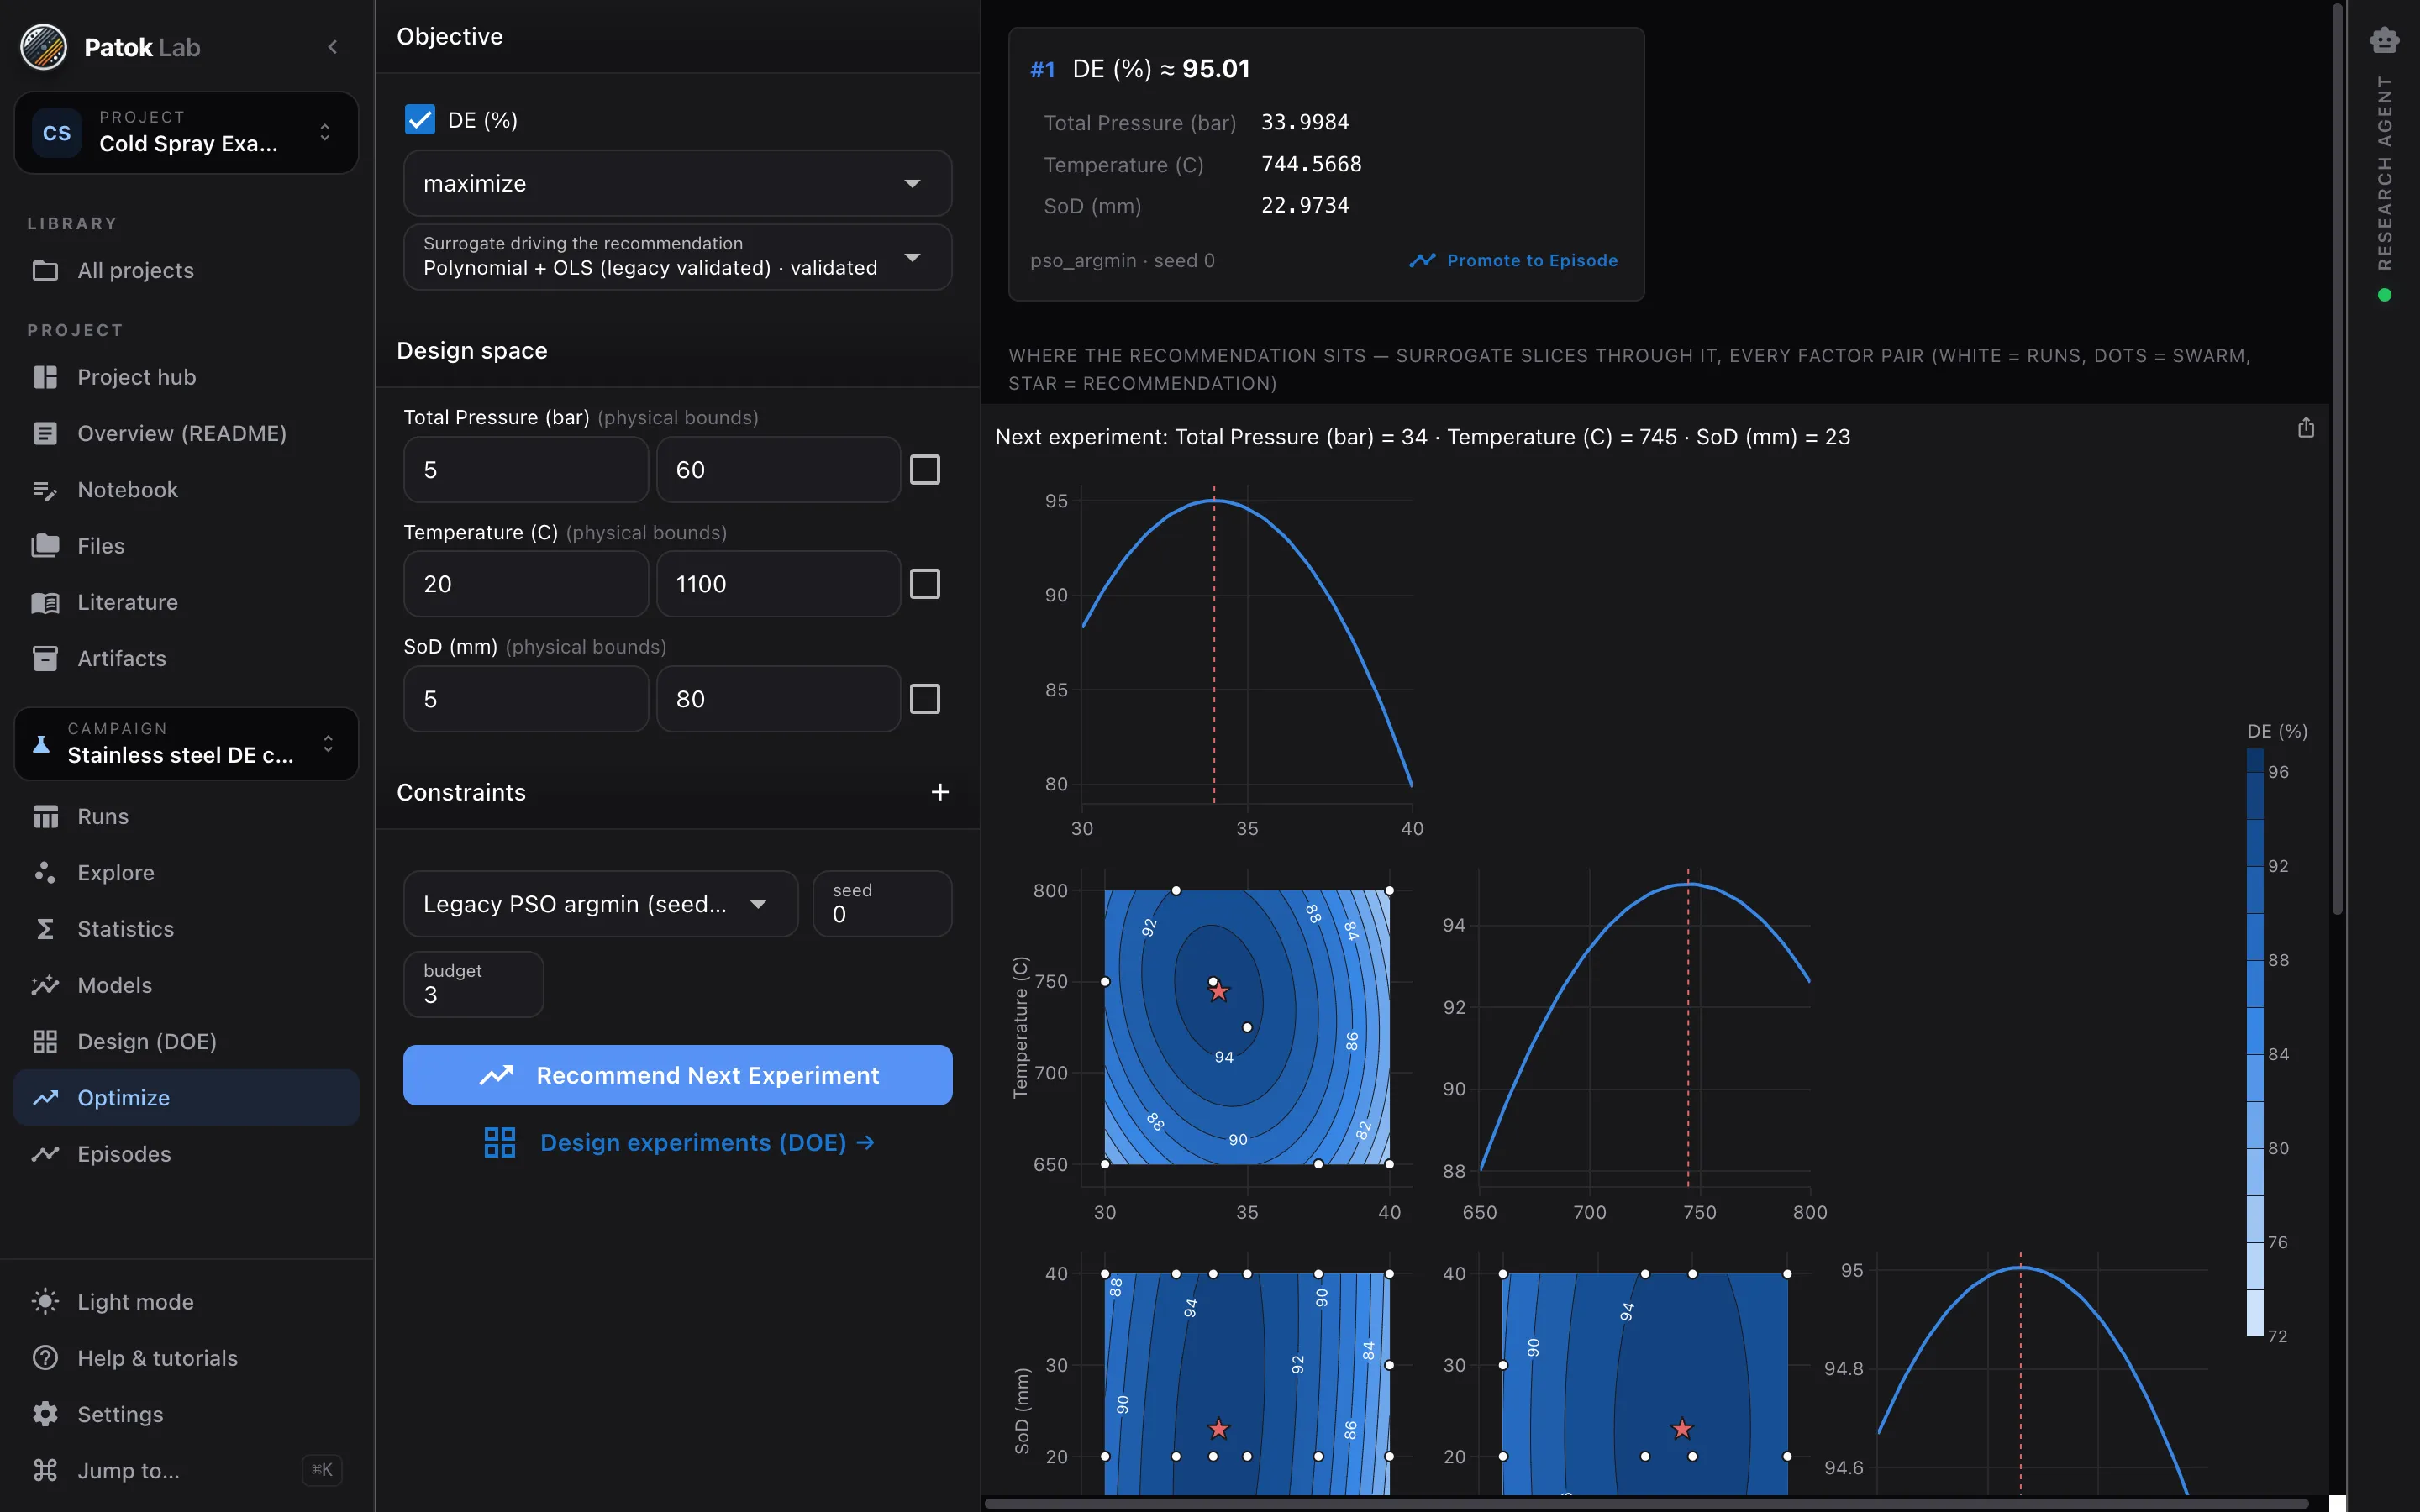
    Classic designs and effects analysis when you plan; the validated sequential optimizer when you already have runs and want the next one.

    Optimize: recommended next experiment
  5. 05

    Record the episode

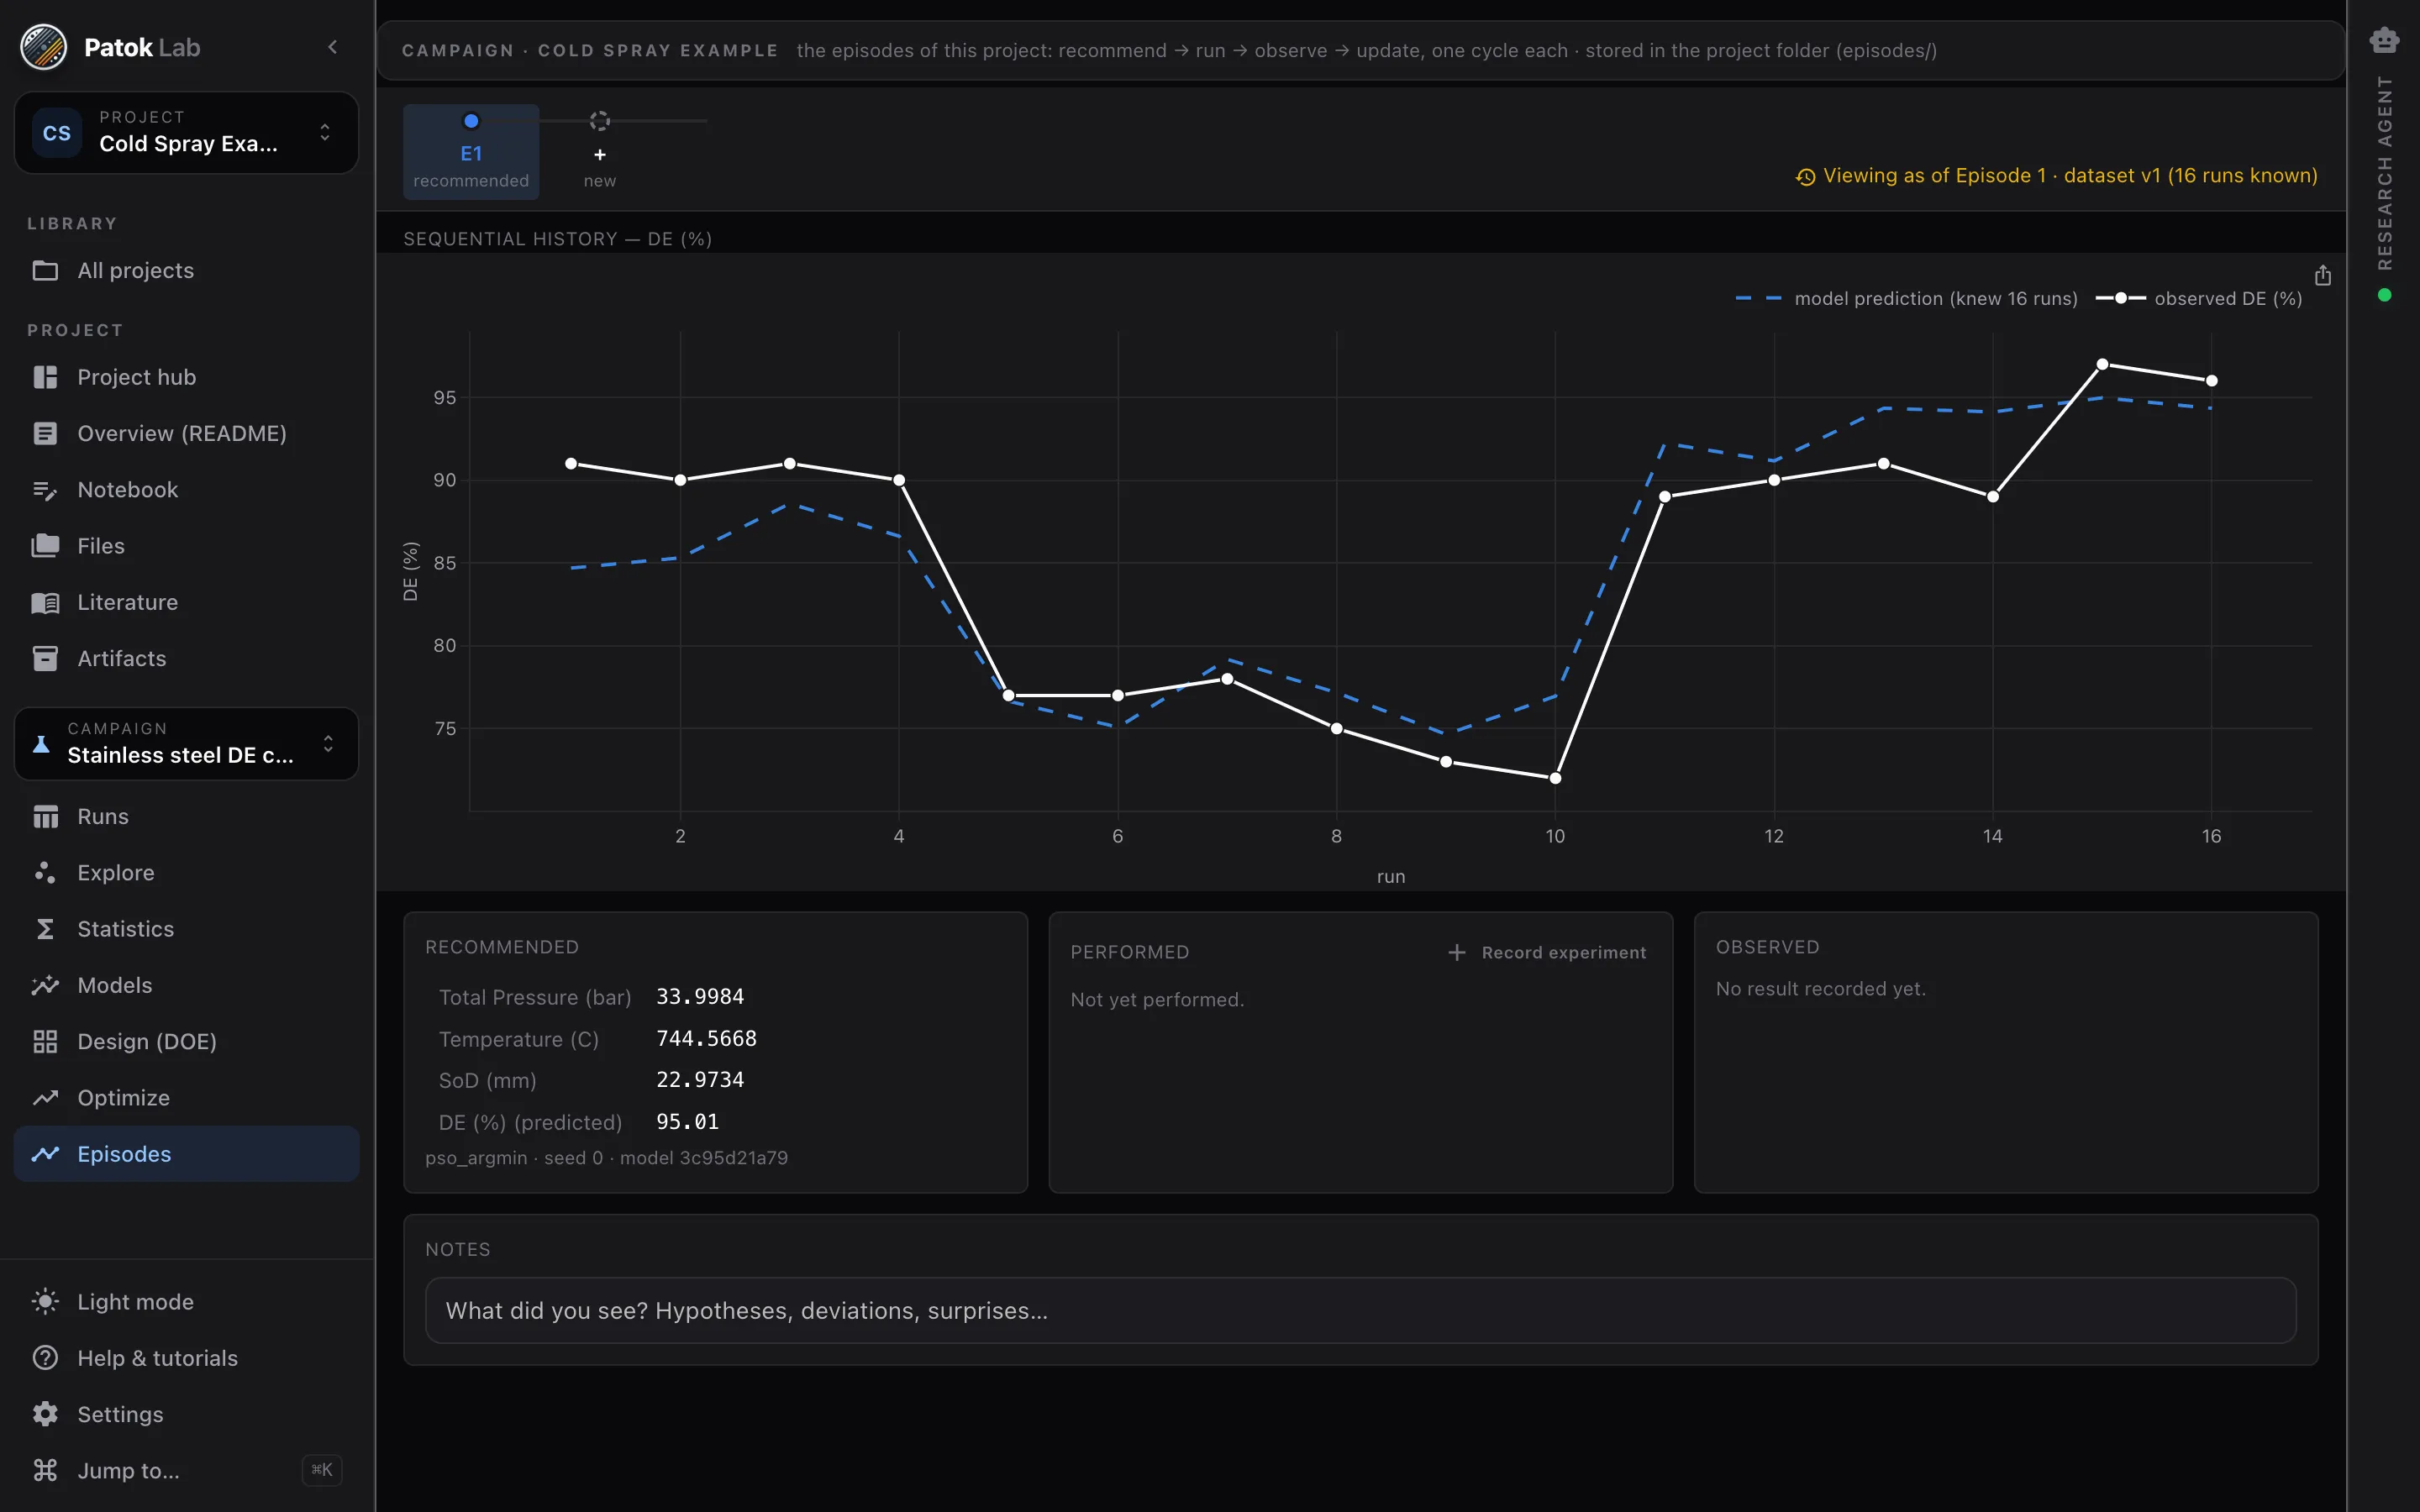
    Promote, run, observe. The table gets a new version with provenance; time-travel to any episode.

    Episodes view
  6. 06

    Report and ask

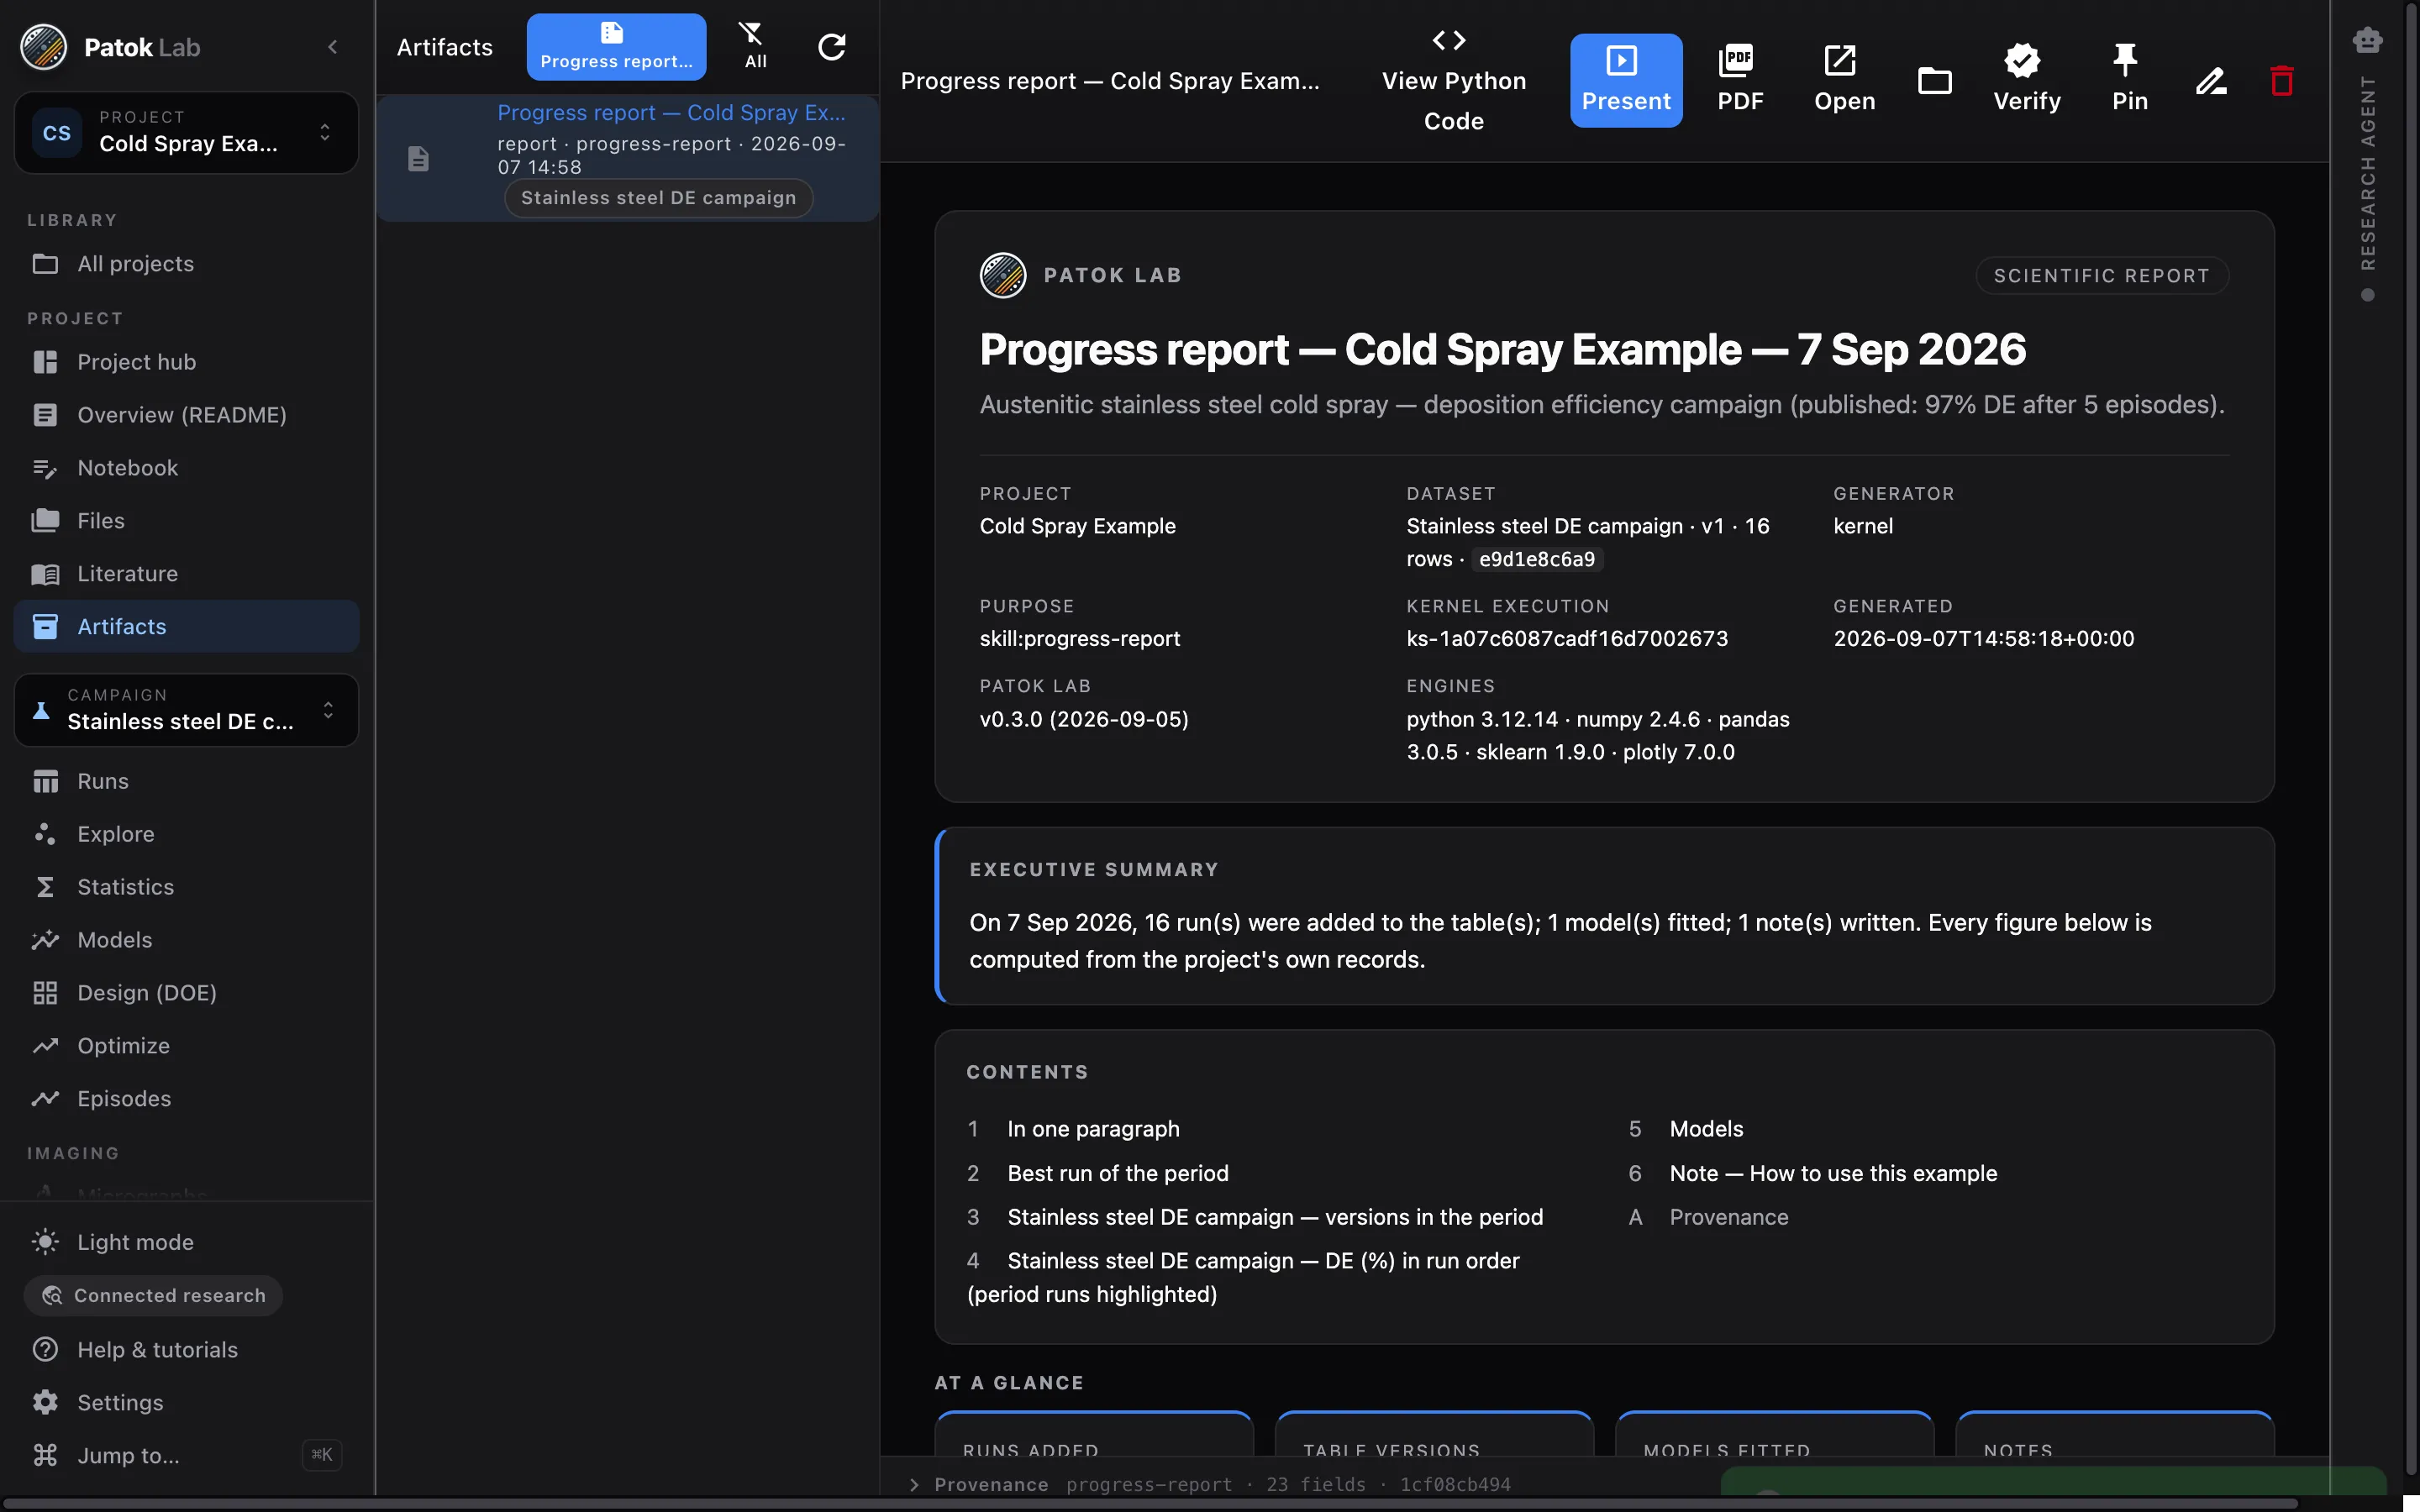
    A progress report writes itself from the project’s records, with present mode and PDF. The agent runs the same engines with a local model.

    Progress report artifact

One loop

Every door feeds the same loop.

A measured micrograph becomes a column. A robot path is kept with the run that used it. The model refits, the optimizer recommends, and the campaign remembers every step.

  • Measurement → column

    Batch porosity and thickness land in the runs table with provenance to each result.

  • Path → run

    Stand-off, speed and step-over become input columns, matched to the coupon they sprayed.

  • Run → recommendation

    The surrogate refits on what you observed and proposes the next experiment.

From one measurement to a distribution, from a distribution to a surrogate surface, from the surface to the next experiment.

The two ends of the same workspace

What comes in

Literature that keeps its evidence
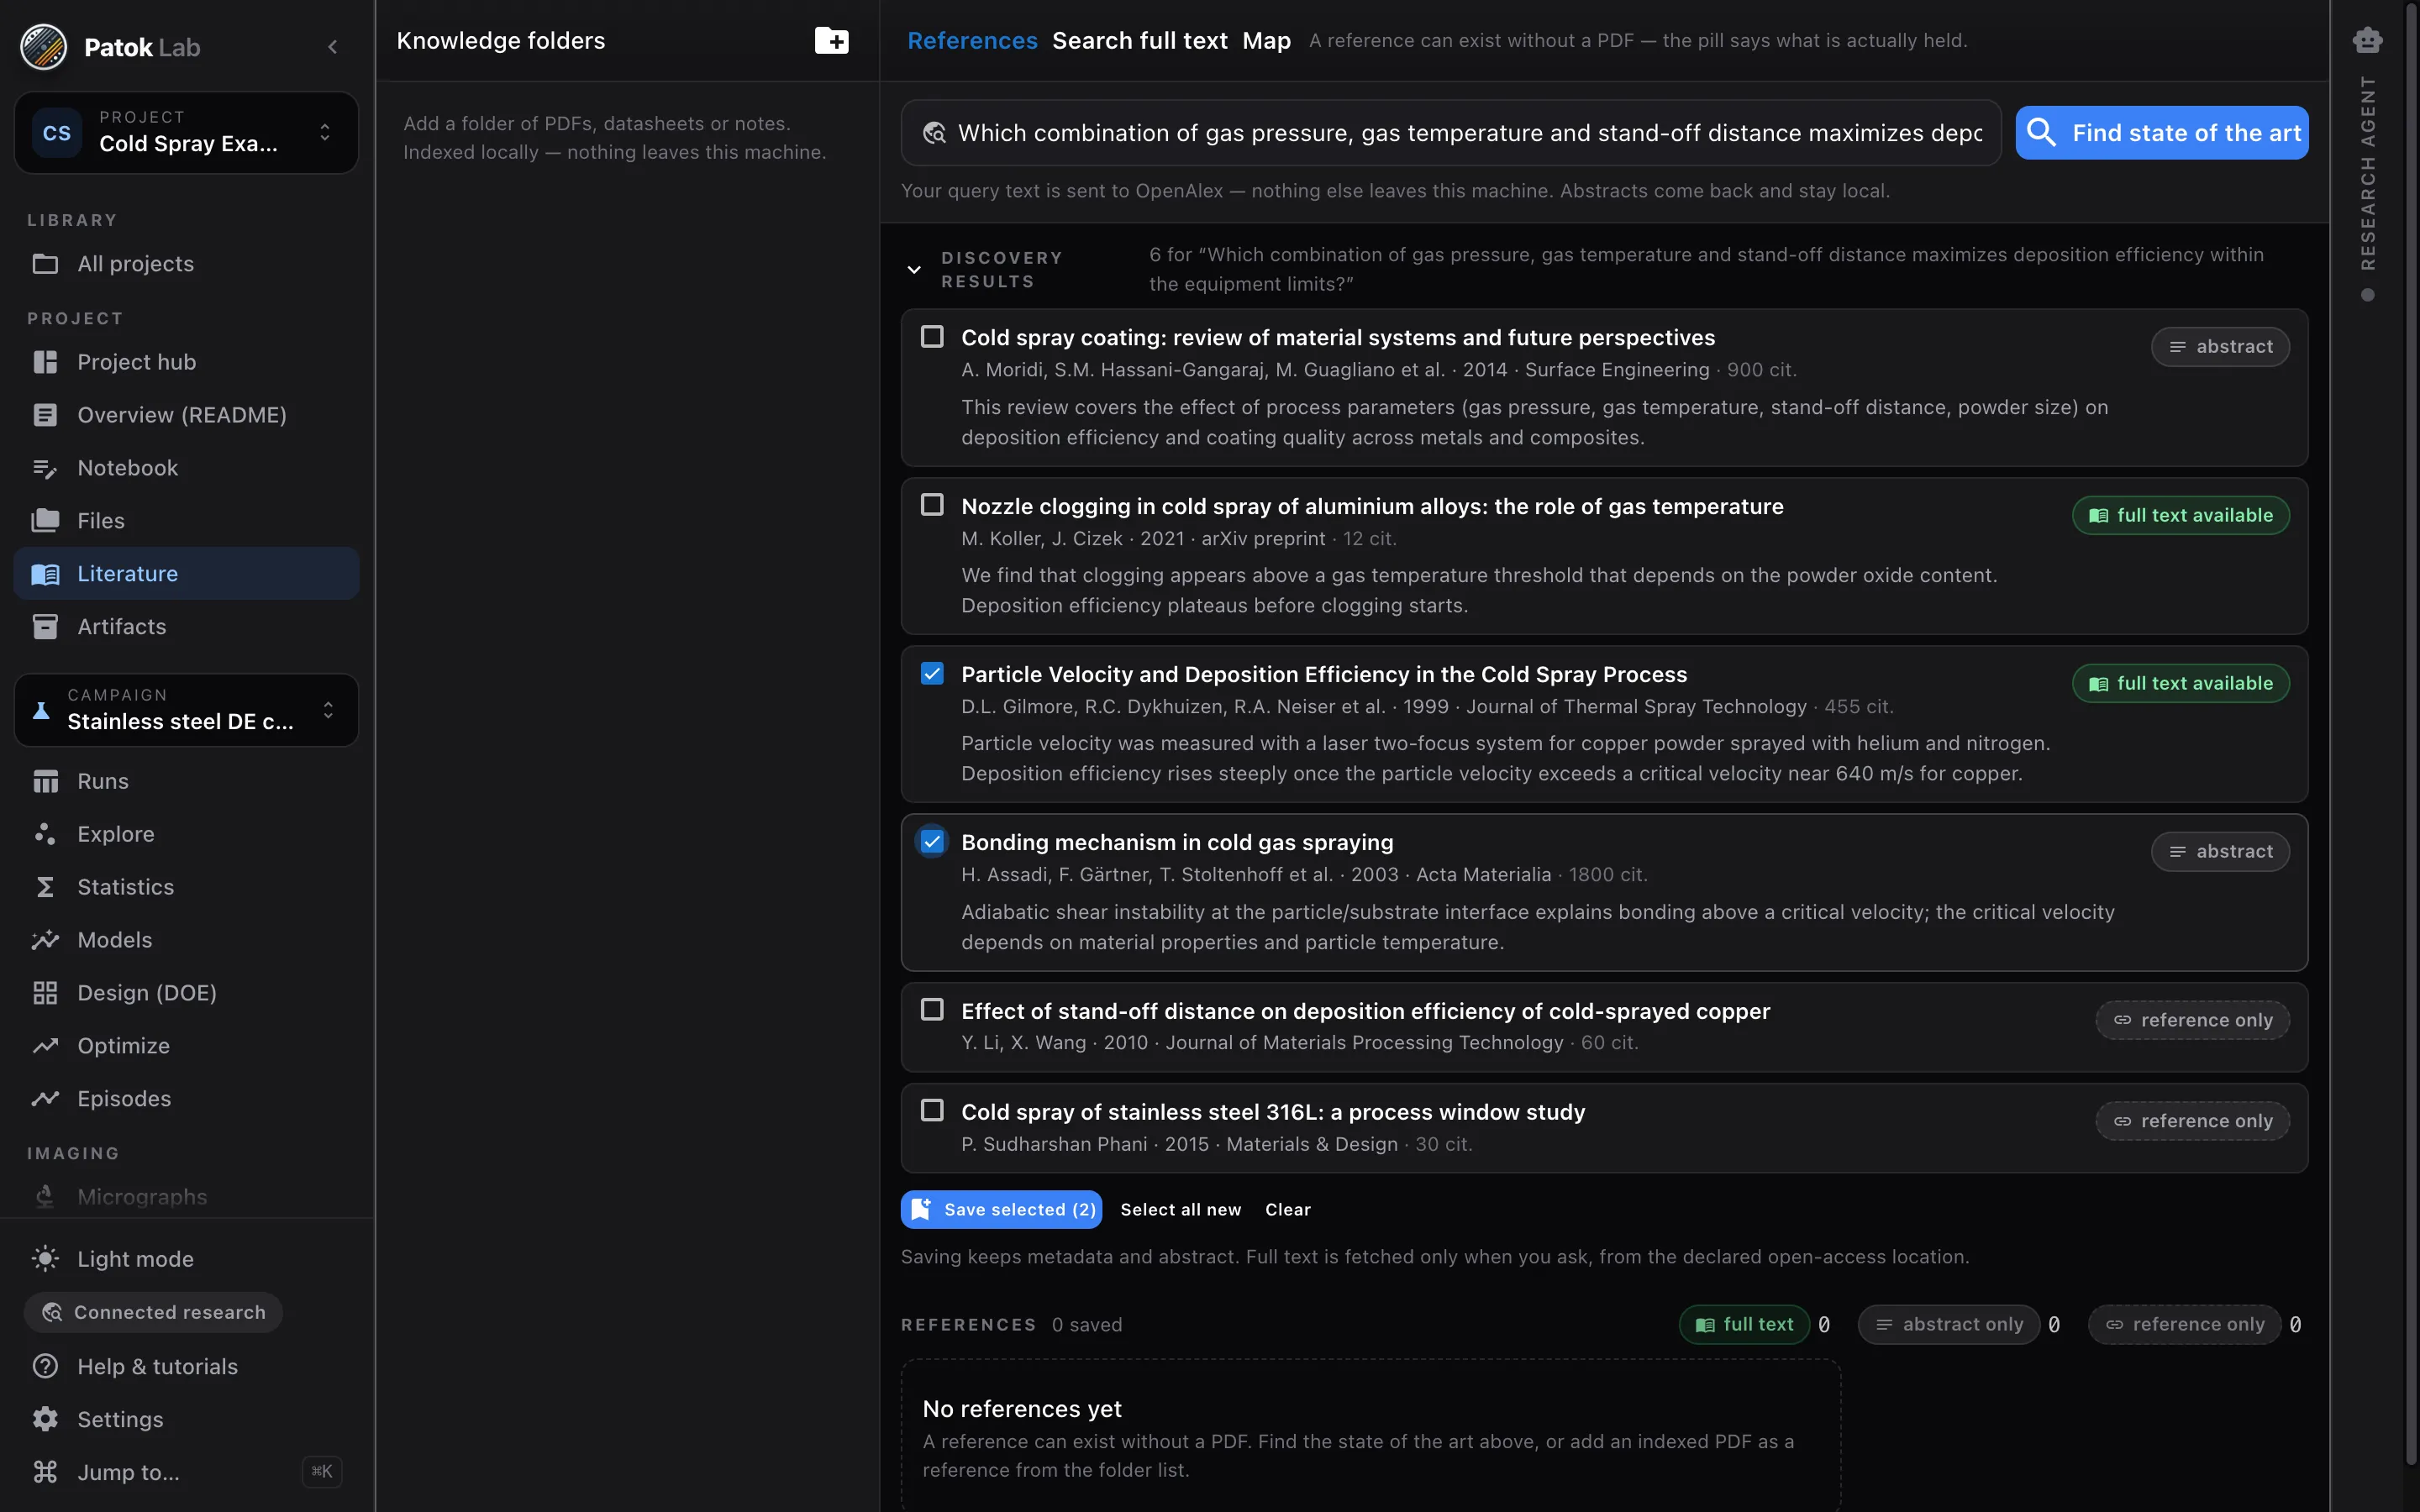
Patok Lab — Literature: candidates for the research question, each labelled full text, abstract or reference only

References with or without a PDF, each labelled by what you actually hold. Find the state of the art, fetch what is open access, index your own papers and search them page by page. A citation enters the notebook with its page and its evidence label attached.

  • Your own PDFs, indexed locally
  • Find state of the art · fetch open access
  • Citations that must resolve
From a research question to a cited page — 77 s, from tutorial 08.

What comes out

A progress report that writes itself

Patok Lab — the progress report of a period: cover, at a glance, best run, figures and the measurements with their overlays

Pick a period and the report assembles from the project’s dated records: what was added, the models and their verdicts, the best run and its settings, the measurements with their overlays, the notes. Present it, export the PDF, or ask the agent to reorder the outline. No language model writes the numbers.

  • Monday’s meeting, thesis chapter or plant review
  • Every figure points back to its record
  • Each version is a new artifact
A week of a campaign becomes one report — 81 s, from tutorial 11.

Finding literature needs a connection: only the text of your question leaves the machine, never your data. Your own PDFs are indexed and searched locally. The report is assembled deterministically by a built-in skill from the project’s records — the agent can only re-run it with outline actions.

See it in one minute

From the table to the next experiment — 70 seconds from the tutorial.

What you can check

  • The same seed gives the same recommendation, byte for byte.
  • Every model carries its cross-validation numbers and a verdict, not a score.
  • Every figure exports for publication (SVG, PDF, 300-dpi PNG) at journal widths.
  • Six example projects ship with the app, hand-out CSVs included.

What it is not

  • Not a statistics package: the statistics are the same ones you would defend in a report; the product is the loop that keeps them.
  • Not a chatbot: the agent proposes, you save; it cannot invent a number it did not compute.

Typical starting points

  • A screening design in the drawer

    Eleven runs of a 2⁴⁻¹ with center points: effects, Pareto, aliasing, curvature — then generate the follow-up design.

  • Eighteen months of process data

    Parameters and results as one table: which variables explain the defects, and where the process is capable.

  • A campaign that must converge

    Six screening runs, a surrogate, the next experiment. Repeat until the response is where you need it.

Early access

Early access for people who run real processes — labs, engineering teams and shops.

Bring a customer drawing, a table of runs, a folder of micrographs or a part you spray, weld or mill. We want Patok Lab used on live work and told what breaks. The Community edition is free, with no time limit; macOS, Windows and Linux.

  • macOS, Windows and Linux — tell us which one you need first
  • Direct line to the founder during early access
  • Optional workshop for your group or team: bring a job, leave with an artifact
  1. 01Tell us what you would bringA drawing, a table of runs, a folder of micrographs, a part, a line.
  2. 02The build arrives by e-mailInstaller, a licence you paste once, and a short guide for the bench you came for.
  3. 03Reply with your fileWe look at it before we send it, and a person answers — not a form.

Get access Bring a drawing, some photos, a table or a part. Or just tell it.

Bringing it to a team, a shop or a university group? Ask for your team →

FAQ

Questions engineers and researchers ask first.

Do I need another software licence?

No. The calculation engine is bundled; the statistical procedures, curve fitting and models run locally without anything to install.

What about designed experiments?

Full and fractional factorials, Plackett-Burman, central composite, Box-Behnken and Latin hypercube designs in the classic layout, plus effects analysis of the runs you already have.

How is this different from a Bayesian optimizer?

The sequential engine refits a surrogate and optimizes it inside your physical bounds; no acquisition function to tune, repeatable: the same seed gives the same answer, and every episode is kept with what you observed.